“With 84 companies responding, the PMPA Business Trends Index for June 2018 held steady at 138, highest June on
record and tied with May 2018. The calendar year average remains 136. The 2018 June index of 138 is 2.2% higher
than June 2017’s 135 value. This is our Index’s highest value recorded for June, and is our second highest value ever
recorded (March 2018’s 143 was the highest ever).”- PMPA Business Trends Report- June 2018

2018 continues to set a blistering pace for the performance and sentiment indicators that we
track. June 2018 is now our second highest sales Index ever- tied with May 2018- while March 2018 was our all-time
high. Our forward- looking indicators remain strongly positive even as they reflect some softening from our current record
levels of performance. Our industry continues to outperform 5-year averages by a wide margin- ~10.4% for June!
See the full report here: https://www.pmpa.org/news/latest-news/2018/07/24/pmpa-business-trends-june-2018

P.S- Employment Sentiment: Prospects for employment are positive and strengthening with ninety-eight percent (98%)
expecting level or increased opportunities for employment!
photo credit: Life of Dad blog
Author: Miles Free
In case you were wondering how well the US Department of Commerce is taking care of the exclusion requests by American Metalworking companies, here’s some data.

Requests for exclusions for both steel and aluminum have less than a half of a percent chance of being approved- 0.35% for steel and 0.47% for aluminum.
Where else but government is this level of performance tolerated?
We will update this from time to time.
In case you were wondering how well the US Department of Commerce is taking care of the exclusion requests by American Metalworking companies, here’s some data.
Requests for exclusions for both steel and aluminum have less than a half of a percent chance of being approved- 0.35% for steel and 0.47% for aluminum.
Where else but government is this level of performance tolerated?
We will update this from time to time.
The 2017 final rule established new permissible exposure limits.
It also included provisions to protect employees from exposure to Beryllium, such as
- requirements for exposure assessment,
- methods for controlling exposure,
- respiratory protection,
- personal protective clothing and equipment,
- housekeeping,
- medical surveillance,
- hazard communication,
- recordkeeping
Do you machine Beryllium in your shop?
Have you evaluated your compliance to the above 8 points of regulatory concern?
Do you know the key regulatory enforcement and compliance dates?

If your shop machines any of the following Beryllium Copper grades, it does apply to you:
Beryllium Coppers C17000, C17200, C17300, C17410, C17500, C17510
The rule applies to occupational exposure to Beryllium in all forms, compounds, and mixtures in
general industry, construction, and shipyards.
- Employers that are covered under the rule must use engineering and work practice controls to
keep exposures at or below the PELs. - Engineering controls include using process isolation, ventilated enclosures, or local
exhaust ventilation to keep beryllium from being dispersed throughout a work area. - Examples of work practices to control beryllium exposures include keeping surfaces
clean by using a HEPA-filtered vacuum or by wetting down dust before sweeping it up. - If engineering and work practice controls cannot keep exposures at or below the PEL,
employers must provide respiratory protection to affected employees.
PMPA is providing members with sensemaking regarding this final rule, compliance dates and strategies, and helpful links to better understand their responsibilities.
PMPA Beryllium Final Rule Members Only
Photo of VR38 Nissan GTR Beryllium Copper Valve Seats courtesy of Fast Forward Race Engines on Facebook
Not a PMPA member? Contact Matthew Hooper to learn more gro.apmp@repoohm
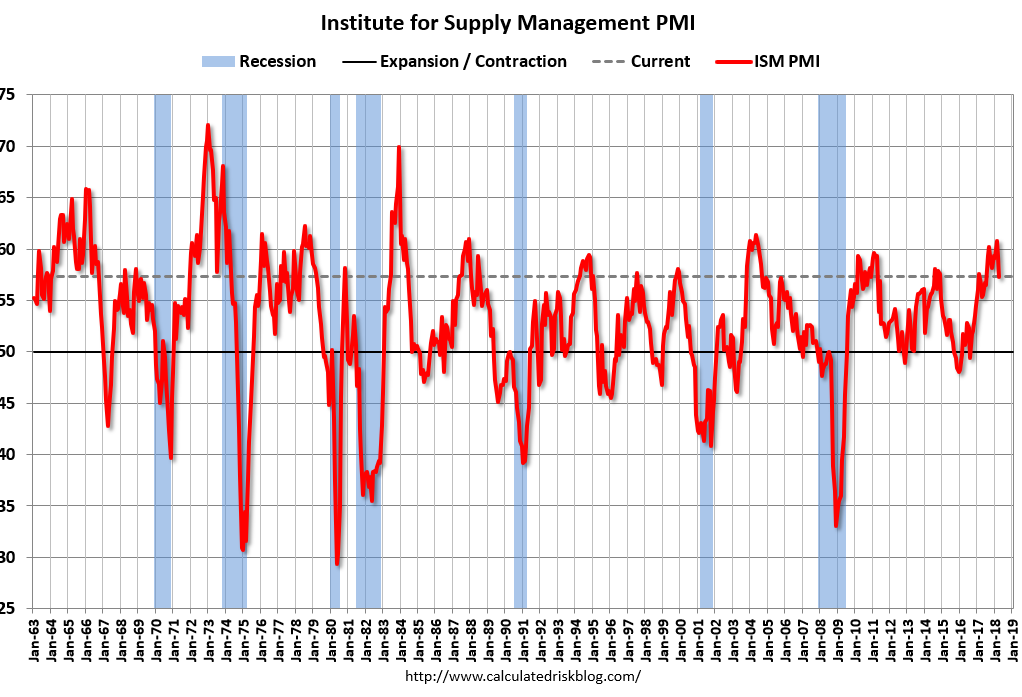
Despite the uncertainty of the US Section 232 Tariffs on Steel and Aluminum, demonstrably higher steel prices, full employment, and trucking difficulties, US manufacturing is having a strong year, as evidenced by the June ISM PMI.
““The June PMI® registered 60.2 percent, an increase of 1.5 percentage points from the May reading of 58.7 percent… The Supplier Deliveries Index registered 68.2 percent, a 6.2 percentage point increase from the May reading of 62 percent…
“Demand remains strong, with the New Orders Index at 60 percent or above for the 14th straight month, and the Customers’ Inventories Index remaining low. The Backlog of Orders Index continued to expand, reading at 60 percent of higher for the third consecutive month. Consumption, described as production and employment, continues to expand in spite of labor, skill and material shortages.””- Timothy R. Fiore, CPSM, C.P.M., Chair of the Institute for Supply Management® (ISM®) Manufacturing Business Survey Committee

PMPA members have reported price increases for Steel and Aluminum as a result of the imposition of the Section 232 steel tariffs, with lead times for raw materials lengthening and growing more uncertain and base steel prices up by 20 percent since March.

Steel prices are at their highest level since the 2009 recession, and the difference between US prices and foreign steel prices are at a record differential according to Steel Benchmarker.
Precision Machining Industry Sales in May second highest level on record. Our latest Business Trends Report for May 2018 showed our industry’s sales at their second highest level ever. We remain strongly positive on outlook for our manufacturing industry, confirming the ISM PMI Report.

We continue to hear reports of issues in trucking industry, including loss of routine deliveries caused by the strict adoption of electronic logs and enforcement of driver time shortening the reach of mills for deliveries out of state.
There are more job openings than people to fill them according to the JOLTS report of the Bureau of Labor Statistics.
Manufacturing in Europe and China cooling. According to Reuters “Euro zone factory growth slowed to an 18-month low in June, slipping for the sixth month in a row amid widespread concerns about trade barriers and their impact on overall economic activity, a survey showed on Monday.”Euro zone factory growth slowed to an 18-month low in June.
“Growth in China’s manufacturing sector cooled slightly in June as firms faced rising input costs and a decline in export orders amid an escalating trade dispute with the United States, a private survey showed on Monday.” Growth in China manufacturing sector ebbs in June.
Bottom line:Despite the uncertainty, US manufacturing is having a strong year, as evidenced by the June ISM PMI. This is in strong contrast to pessimistic manufacturing activity readings from Europe and China which are not at all positive. And in spite of uncertainty and challenges we face from tariffs, trucking, employment, pricing and other issues.
ISM PMI June 2018 Announcement
Steel Benchmarker Steel Price History
Graph Courtesy Calculated Risk Blog
PMPA Business Trends Report May 2018
Job Openings
PMPA Business Trends Sales Index for May climbed to its second highest value ever as forward looking indicators for Sales, Lead Time, Employment and Profitability softened but remained positive.
Our year to date average is 136, up 11 points or 8.8% over 2017’s year-end average of 125.
We are at 106% of where we were a year ago in May.
The FED reported that Industrial Production (IP) Industrial Production edged down 0.1 percent in May after rising
0.9 percent in April. Manufacturing production fell 0.7 percent in May, largely because truck assemblies were disrupted by
a major fire at a parts supplier. Excluding motor vehicles and parts, factory output moved down 0.2 percent.”
Our industry is clearly outperforming IP- they cannot make it until we produce the precision components needed.
The sentiment indicators while lower, still remain in positive territory, and are likely based on the realization that the summer is typically less demanding than the first quarter.
Full report available HERE
According to the just released Manufacturing ISM® Report On Business® “No industry reported a decrease in PMI® in May compared to April. Economic activity in the manufacturing sector expanded in May, and the overall economy grew for the 109th consecutive month; the May PMI® registered 58.7 percent, an increase of 1.4 percentage points from the April reading of 57.3 percent.” – Timothy R. Fiore, CPSM, C.P.M., Chair of the Institute for Supply Management® (ISM®) Manufacturing Business Survey Committee.
Here are the key points:
- The May PMI® registered 58.7 percent, an increase of 1.4 percentage points from the April reading of 57.3 percent.
- The New Orders Index registered 63.7 percent, an increase of 2.5 percentage points from the April reading of 61.2 percent.
- The Production Index registered 61.5 percent, a 4.3 percentage point increase compared to the April reading of 57.2 percent.
- The Employment Index registered 56.3 percent, an increase of 2.1 percentage points from the April reading of 54.2 percent.
- The Inventories Index registered 50.2 percent, a decrease of 2.7 percentage points from the April reading of 52.9 percent.
- Demand remains strong, with the New Orders Index at 60 or above for the 13th straight month, and the Customers’ Inventories Index remaining at very low levels.
- The Backlog of Orders Index continued expanding, with its highest reading since April 2004, when it registered 66.5 percent.

Consumption, described as production and employment, continues to expand in the face of labor shortages, skill shortages and both price and supply uncertainty on necessary material inputs, primarily driven by the Section 232 Tariffs.
Just as the national anthem is a sign that the ball game is about to start, this ISM report is our signal that we need to start having price increase discussions with our customers.
The tariffs are here, and our inputs are all increasingly difficult to obtain and expensive.
[youtube https://www.youtube.com/watch?v=f5gkkBtRK_U]
Game on!
Despite a drop of two points from 59.3 to 57.3, the April Institute for Supply Management Purchasing Managers Index (ISM-PMI) indicated continued solid, but slowing growth in the manufacturing sector. Of the 18 Manufacturing Industries, 17 reported growth in April. Demand remains robust, but the nation’s employment and supply chains continue to struggle- April 2018 ISM PMI, Timothy Fiore, Chair, ISM Manufacturing Business Survey Committee.
The April report noted declines in other indexes such as New Orders (down 2 points); Production Index (down 3.8 points); New Orders down 0.7 points); and he Employment index (down 3.1 points) compared to March. Prices index was up 1.2 percent from prior month, indicating the 26th consecutive month of gains.
The prices index is currently at its highest value since April 2011; 17 of 18 industry sectors reported price increases.

What is going on in manufacturing? Here are a couple of comments from some of the ISM’s respondents:
- “Business is off the charts. This is causing many collateral issues: a tightening supply chain market and longer lead times. Subcontractors are trading capacity up, leading to a bidding war for the marginal capacity. Labor remains tight and getting tighter.”
- “[The] 232 and 301 tariffs are very concerning. Business planning is at a standstill until they are resolved. Significant amount of manpower [on planning and the like] being expended on these issues.”
- “The recent steel tariffs have made it difficult to source material, and we have had to eliminate two products due to availability and cost of raw material.
PMPA’s March Business Trends Report just came in and showed a record high at 143 for sales. We look forward to seeing what our April report has in store.
Chart courtesy Calculated Risk Blog
ISM April PMI Report
“With 91 companies responding, the PMPA Business Trends Index for March 2018 increased 14 points or 10.8% over
February to 143, the highest value for the Business Trends Index EVER! At 143, the index is up 11.2 points or 8.5%
above the five-year average for the March sales index of 131.8. ” – PMPA March 2018 Business Trends Report

Sentiment indicators from our respondents remained high. PMPA members can get the full report here. Press can request a copy – we’ll be happy to share.
Two of three months in 2018 have set new records for sales. Our industry is outperforming five year averages by wide margins- up 8.5% for March.
Prospects for employment remain high in our shops, even as the national figures tout “full employment.”
If you know someone that is underemployed, or unemployed, the prospects for great careers in our precision manufacturing shops have really never looked better.

Lion
March 2018 PMPA Business Trends Report
Great Careers
The PMPA Business Trends Index for January 2018 jumped to 135, up 25% over December 2017, and up 5% over January 2017. This is up 8.9% over the five year average for January Sales, and is our highest January on record.

Change your thinking to thrive to this new market.
Cheap inputs that cost your shop capacity are no bargain, when there are no shops scheduling less than 40 hours and 71% of shops are scheduling overtime. It is all about UPTIME in this current market. There are no bargains worth having that cost you uptime. And that means training your people is essential as well.
What we are hearing “falling behind…exceeded forecast by 10%…Can’t get it out quick enough…Picking which jobs to run…” Almost three quarters of shops reporting (74.3%) reported sales increases up by ten percent or more in January.
The Fed reported that Industrial Production (IP) “edged down 0.1 percent in January following four consecutive monthly increases. Manufacturing production was unchanged in January.” Our industry is clearly a leading indicator for IP- they cannot make it until we produce the precision components needed.
Last January we said that “…the animal spirits have escaped confinement and are driving the manufacturing economy to performance not seen in years.” Last month we reported that industry sales “were up 6.8% for the year, a multiple of GDP growth.”
This report for January 2018 shows that our responding shops are outperforming the five-year shipments average for the month of January by almost 9%.
Our Lead Time indicator suggests that some shops are starting to think about capacity constraints. Strong sentiment for profitability tells me that no one is “buying” business by cutting margins. Our Employment indicator recognizes that to continue production at these levels, we need to add talent. Our performance and sentiment indicators this month justify our optimism about the markets and employment prospects for our precision machining industry in this New Year.
It is all about UPTIME in this current market. Cheap inputs that cost your shop capacity are no bargain. Change your thinking to thrive to this new market.
PMPA January 2018 Business Trends Report
Fed January 2018 Industrial Production Report